We have set "Conserving resources and energy, and promoting the introduction of renewable energy" as a key materiality action plan. The plan includes a KPI of reducing domestic CO2 emissions by 50% or more by fiscal 2030 compared to fiscal 2013, and we are proactively working toward achieving this target. Concrete measures undertaken by Maxell Group as part of plant electricity-saving measures include visualizing electricity consumption patterns to reduce wasteful electricity usage, improving operational efficiency through demand management at facilities, updating air conditioning systems, switching to LED lighting, and planting of green walls. In fiscal 2022, the Kobuchizawa Works, Kyoto Works, and Ono Works began solar power generation for in-house consumption. In fiscal 2025, the Kobuchizawa Works generated 168 MWh, the Kyoto Works generated 605 MWh, and the Ono Works generated 714 MWh, and Maxell Toshin (Malaysia) Sdn. Bhd., which newly introduced a solar power generation system, generated 1,169 MWh of electricity. We also started purchasing non-fossil certificates in fiscal 2022.As a result of these initiatives, we achieved our KPI of "10% domestic renewable energy ratio by FY2030" already in fiscal 2022, and we therefore have revised the KPI to a more ambitious target of 15%.
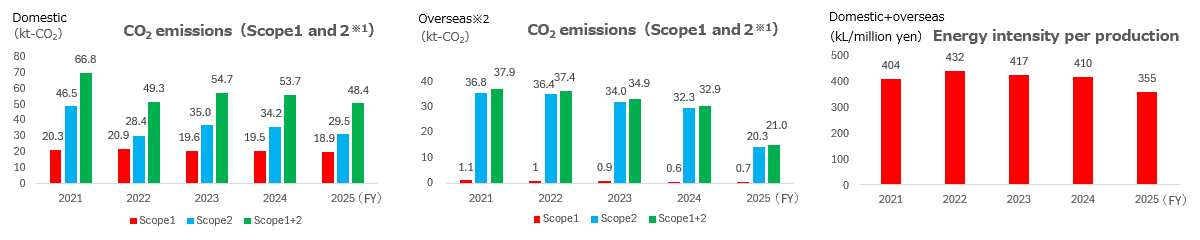
Our domestic CO2 emissions in fiscal 2025 dropped by 10% from the previous year, while overseas emissions dropped by 36%, leading to an overall drop of 20% across the Group as a whole (domestic:down 48% compared to fiscal 2013). The decrease in overseas CO₂ emissions was mainly due to the discontinuation of Prismatic Lithium-ion Rechargeable Batteries production at a plant in China. In the future, we will continue to reduce electric power through energy-saving activities, introduce solar power generation for in-house consumption, and increase our percentage of non-fossil certificates. In addition to solar power generation for in-house consumption, the Ono Works is also selling electricity generated with its solar power facilities. In fiscal 2025, 1,428 MWh of electricity was generated for this purpose, contributing to the prevention of global warming.
*1 Scope1: Direct emissions due to fuel combustion etc.at business site Scope2: Indirect emissions from purchased electricity,etc *2 Electricity/CO2conversioncoefficient: Malaysia0.63, China0.59, Indonesia0.79(unit is t-CO2/MWh for all countries)
(Unit: kt-CO2/year)
Domestic
2021
2022
2023
2024
2025
Scope1
20.3
20.9
19.6
19.5
18.9
Scope2
46.5
28.4
35.0
34.2
29.5
Total
66.8
49.3
54.7
53.7
48.4
Overseas
2021
2022
2023
2024
2025
Scope1
1.1
1.0
0.9
0.6
0.7
Scope2
36.8
36.4
34.0
32.3
20.3
Total
37.9
37.4
34.9
32.9
21.0
Data Coverage: figures for the entire Maxell Group
Reduction of CO2 Emissions Including Scope 3
Maxell Group calculates total CO2 emissions across the entire supply chain, including Scope 3 emissions. Scope 3 emissions refer to indirect emissions other than Scope 1 and Scope 2 emissions. For emissions calculations, starting from fiscal 2018, we aggregate and disclose performance data in accordance with the "Basic Guidelines on Accounting for Greenhouse Gas Emissions Throughout the Supply Chain" issued by the Ministry of the Environment and the Ministry of Economy, Trade and Industry.
(Unit: kt-CO2/year)
Scope3
2021
2022
2023
2024
2025
1.Products/services purchased
194.6
155.0
218.5
197.3
195.5
2.Capital goods
10.9
13.2
19.1
20.8
15.9
3.Fuel and energy related activities not included in Scope 1 and 2
11.0
11.1
14.1
14.2
12.5
4.Upstream transportation/distribution
3.7
3.5
11.1
9.4
8.7
5.Waste generated in operation
1.0
1.0
4.1
4.3
5.0
6.Business trip
0.7
1.0
1.3
1.3
1.5
7.Commuting of employees
1.4
1.3
2.0
2.0
1.9
8.Upstream leased assets
0.0
0.0
0.0
0.0
0.0
9.Downstream transportation/distribution
0.0
0.0
0.0
0.0
0.0
10.Processing of products sold
0.0
0.0
0.0
0.0
0.0
11.Use of products sold
39.2
3.8
5.2
4.9
4.7
12.Disposal of products sold
45.5
38.4
36.4
19.9
21.6
13.Downstream leased assets
0.0
0.0
0.0
0.0
0.0
14.Franchises
0.0
0.0
0.0
0.0
0.0
15.Investments
0.0
0.0
0.0
0.0
0.0
Scope3
2021
2022
2023
2024
2025
Total
308.0
228.3
311.7
274.0
267.4
Data coverage: Values for Maxell and Maxell Frontier until FY2022, and values for the entire Maxell Group from FY2023 onwards.
Since Maxell Group offers a wide range of products, we monitor the transport-related energy intensity per production at each manufacturing base. In fiscal 2025, the total figure for all manufacturing bases increased by 5% compared to the previous fiscal year.
Fiscal Year
Production amount (million yen)
Usage (ten thousand ton-km)
Intensity (ton-km/million yen)
2021
58,186
1,014
174
2022
51,919
958
184
2023
53,008
903
170
2024
57,641
890
154
2025
53,618
872
163
Data Coverage: Maxell Only
Waste Reduction and Recycling
With regard to conserving resources as part of our materiality action plan, our recent focus has been on measures for waste plastic as an environmental issue, and we are investigating chemical/materials recycling. Furthermore, at Maxell Group, we are working toward "Zero emissions"*1 by ensuring thorough waste separation, promoting the monetization of valuable waste through information sharing across business sites, and expanding and enhancing in-house intermediate processing.
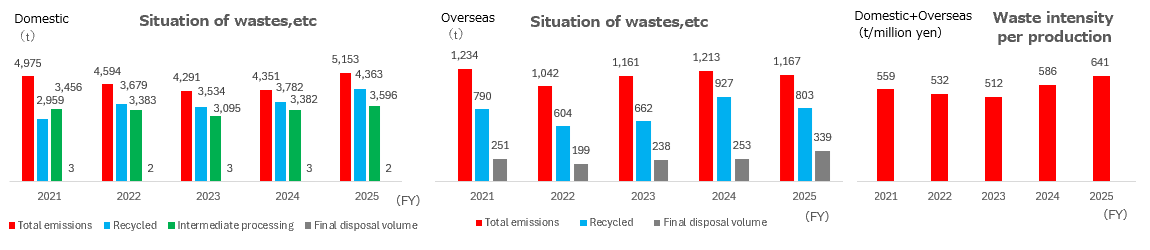
For example, in the lithium-ion battery electrode manufacturing process, we separate paint residue and end cuts generated in each production step, and deliver these to appropriate companies to recycle copper, aluminum, and rare metals such as cobalt (102 tons in fiscal 2025).In the primary battery manufacturing process, in addition to the conventional recovery of silver oxide (2.3 tons in fiscal 2025), we have begun recovering zinc (0.5 tons in fiscal 2025) and copper (0.02 tons in fiscal 2025) since the previous fiscal year, thereby strengthening resource recycling. The amount of valuable waste generated domestically in fiscal 2025 increased by 35% compared to the previous fiscal year.As a result of our intensified recycling efforts, domestic manufacturing bases achieved zero emissions for the 25th consecutive year. *1 Criteria for zero emissions (criteria for each business site): Final waste disposal volume less than 5 tons/year and final disposal ratio less than 1%/year
Situation of wastes, etc.
(Unit: t/year)
Domestic
2021
2022
2023
2024
2025
Recycling
2,959
3,679
3,534
3,782
4,363
Intermediate Processing
3,456
3,383
3,095
3,382
3,596
Final Disposal Volume
3
2
3
3
2
Total Emissions
4,975
4,594
4,291
4,351
5,153
Overseas
2021
2022
2023
2024
2025
Recycling
790
604
662
927
803
Final Disposal Volume
251
199
238
253
339
Total Emissions
1,234
1,042
1,161
1,213
1,167
Data Coverage: figures for the entire Maxell Group
Specified Hazardous Wastes generated
(Unit: t/year)
Specified Hazardous Industrial Wastes
2021
2022
2023
2024
2025
PCB
0.0
0.0
36.0
0.0
1.8
Data Coverage: figures for the entire Maxell Group
Waste Intensity per production
(Unit: t/million yen×10-4)
Domestic/overseas plants
2021
2022
2023
2024
2025
Waste Intensity per production
559
532
512
586
641
Water Consumption Reduction Initiatives
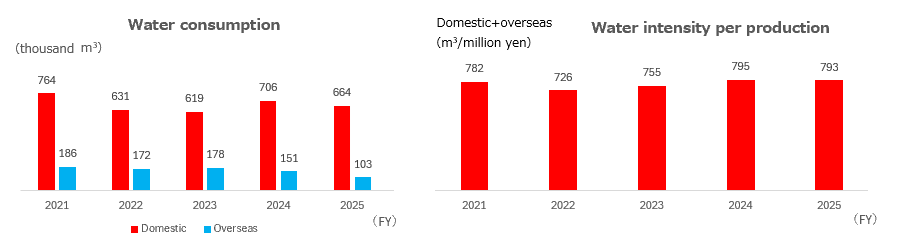
Maxell Group strives to reduce water consumption in manufacturing processes and conserve water resources through reutilization and other practices. For instance, at the Kyoto Works, a system to recover and reuse 100% of drain water was introduced in response to increased steam usage due to the increased production of lithium-ion battery electrodes. This resulted in a saving of 40 thousand m3 of water annually.At domestic Group business sites, water usage decreased by 6% compared to the previous fiscal year, while at overseas Group business sites with high water risk*2, it decreased by 32%. Overall, water consumption in the Maxell Group decreased by 10% compared to the previous fiscal year, mainly due to the discontinuation of Prismatic Lithium-ion Rechargeable Batteries production at a plant in China. *2 Water Risk Atlas (Aqueduct)
Business Activities in Water-Stressed Areas Maxell's overseas group factories are located in China (2 sites), Malaysia (1 site), and Indonesia (1 site). According to the Water Risk Atlas (Aqueduct), these four sites face higher water risks, including baseline water stress and flood risk, compared to domestic sites. Consequently, these overseas factories set annual targets for water consumption intensity and actively work on reducing it.
Water consumption (Water intake volume/Water discharge volume)
(Unit: thousand m3/year)
Water Intake Volume (input volume) Domestic
2021
2022
2023
2024
2025
Water Supply System
203
198
218
239
263
Industrial Water
0
0
0
0
0
Groundwater
561
433
400
467
401
Rainwater
0
0
0
0
0
Total Input Volume
764
631
619
706
664
Water Intake Volume (input volume) Overseas
2021
2022
2023
2024
2025
Water Supply System
172
158
161
136
92
Industrial Water
13
14
18
15
10
Groundwater
0
0
0
0
0
Rainwater
0
0
0
0
0
Total Input Volume
186
172
178
151
103
Water Discharge Volume Domestic
2021
2022
2023
2024
2025
Public Water
157
132
147
156
164
Water Sewerage System
582
480
461
543
446
Total Discharge Volume
739
612
609
699
611
Water Discharge Volume Overseas
2021
2022
2023
2024
2025
Public Water
0
0
0
0
0
Water Sewerage System
181
167
173
145
101
Total Discharge Volume
181
167
173
145
101
Data Coverage: figures for the entire Maxell Group Figures for fiscal 2021 onward were revised retroactively because groundwater at certain domestic sites had been recorded as industrial water.
Water Intensity per production
(Unit: m3/million yen×10-2)
Domestic/overseas plants
2021
2022
2023
2024
2025
Water Intensity per production
782
726
755
795
793
Chemical Substance Management During Production
The Maxell Group manages and strives to reduce the amount of chemical substances handled, emitted, and transferred during the manufacturing process.
(Unit: t/year)
2021
2022
2023
2024
2025
PRTR Law Substances
Handling Amount of PRTR Substances (Domestic)
1,480
1,403
1,622
1,253
1,310
Emission Amount of PRTR Substances (Domestic)
98
80
72
67
127
Transfer Amount of PRTR Substances (Domestic)
192
154
157
160
186
Volatile Organic Compounds (VOC)
Atmospheric Emission Amount of VOC (Domestic)
131
95
130
130
187
Atmospheric Emission Amount of VOC (Overseas)
10.2
21.5
21.0
10.8
11.4
Air Pollutants
SOx Emission Amount
0.2
0.2
0.6
0.3
1.0
NOx Emission Amount
10.7
10.9
9.7
11.1
15.2
Water Pollutants
BOD Emission Amount
11.6
10.1
7.4
4.9
7.2
COD Emission Amount
1.6
2.0
0.9
1.3
1.1
Data Coverage: Up to FY2024 figures for Maxell and Maxell Frontier only. FY2025 onwards, figures for the entire Maxell Group(Domestic) Note: PRTR Law revised in 2023
Environmental Fines and Penalties in Fiscal Year
In 2017, our factory in China received administrative guidance and a fine for exceeding wastewater pollutant concentration standards. Since then, we have installed wastewater treatment facilities and have had no further issues. Learning from this experience, we have implemented sufficient measures to prevent legal violations, and no violations have occurred to date.
(Fiscal Year)
Environmental Violations
Unit
2021
2022
2023
2024
2025
Violation Cases (Fines over $10,000)
Cases
0
0
0
0
0
Fine Cases (Fines over $10,000)
Yen
0
0
0
0
0
Year-end Environmental Liability Amount
Yen
0
0
0
0
0
Data Coverage: figures for the entire Maxell Group
ISO 14001 Certification
(Fiscal Year)
ISO 14001 Certification Rate
Unit
2021
2022
2023
2024
2025
Maxell Group Production and Sales Sites
%
56%
56%
51%
51%
50%
Data Coverage: figures for the entire Maxell Group The acquisition rate decreased due to the integration of domestic sales offices in FY2023 and the discontinuation of production at a plant in China in FY2025